Table of Contents
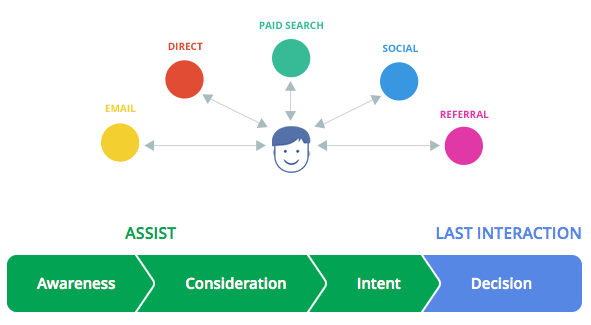
In the travel marketing industry, perhaps even more so than in any other verticals, the increasing power of web interactions, social media and mobile is affecting how customers will make decisions regarding an upcoming trip, from the destination website all the way to transportation options, accommodations, things to see and do, where to eat and, more importantly, where to book it all.
Google Think Insights recently released an interesting tool shedding light on exactly how different channels affect the customer along the decision-making journey. This journey is made-up of four classic stages:
Awareness
In this aspirational stage, destinations usually play the most important role in getting potential travelers’ attention. Before choosing a trip to Bali, you must first have some awareness of its geography and place on the world map, with images or perhaps videos of pristine beaches, nightlife or other iconic landmarks of the destination.
Consideration
Once awareness is achieved, the customer may by now opt for either a golf trip or a ski trip, thus not only being aware of potential destinations, but now considering a select few countries or cities where the upcoming trip may take place.
Be the first to know, sign up here and stay up to date with our latest revenue management news, updates and special offers
Intent
In the next stage, the customer is going into comparison mode, looking at dates, pricing options, and further delving into logistical details: where to stay, to eat, attractions and events during specific dates considered at this point.
This is perhaps the stage where booking platforms are most consulted, both offline and online, either with friends and family or through online travel agencies, social networks and various mobile applications.
Decision
The final stage is when the transaction takes place, either through the travel supplier website or other third parties part of the online travel distribution landscape.
This Google tool is very useful as it allows to compare the travel vertical with the average of many other industries, including auto, biz, classified, CPG, education/government, finance, health, media, retail and tech. It’s also possible to compare results according to different countries, including Brazil, Canada, France, Germany, Japan, U.K. and U.S.
COMPARING INFLUENCE PATHS
As we can see from the Google Think Insights report, customer behave differently and respond differently to various online channel interactions. The first visual shows insights from the travel industry in the US, while the second one focuses on the same decision-making cycle, but in Canada. The points of influence show startling differences!
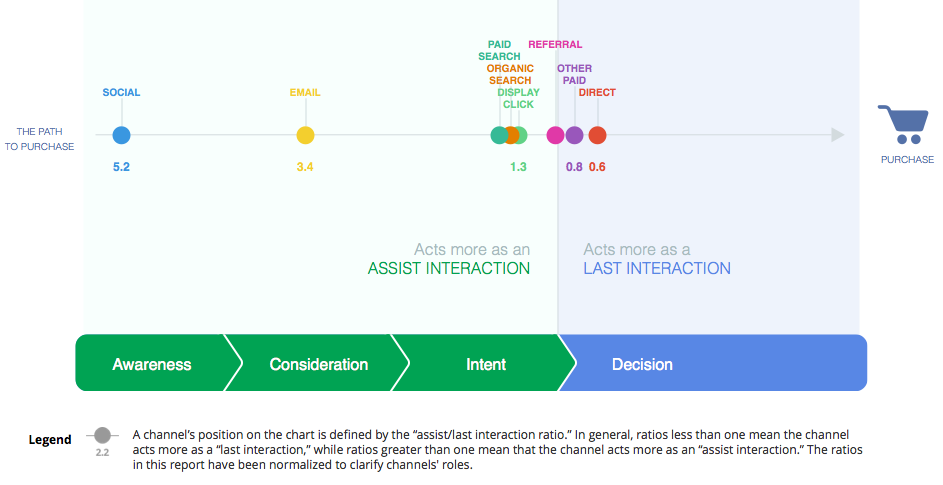
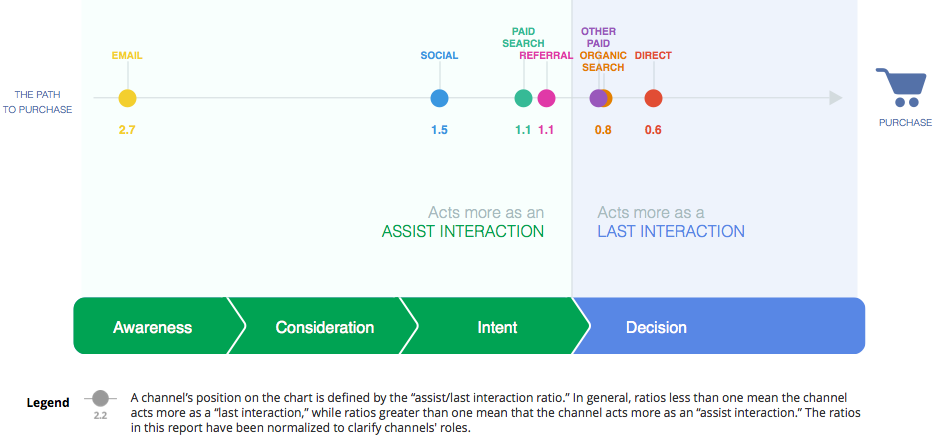
Notice how much “email” is considered a channel influencing potential Canadian travelers upstream, at the awareness stage, while it’s considered much more of a tactical tool at the consideration stage with Americans.
“Social media” also play distinctive roles when comparing Americans and Canadians, as they seem to play a bigger role at the travel intent for the latter group, while influencing much more upstream at the awareness level with the former group. Not many differences, though, when looking at other tactics such as paid search, referral, organic search or direct bookings.
LENGTH & STEPS IN THE JOURNEY
It’s also interesting to see how Americans and Canadians behave differently when it comes to purchasing online travel, as can be seen in the two visuals below, highlighting steps (number of interactions) in the customer journey and purchase value.
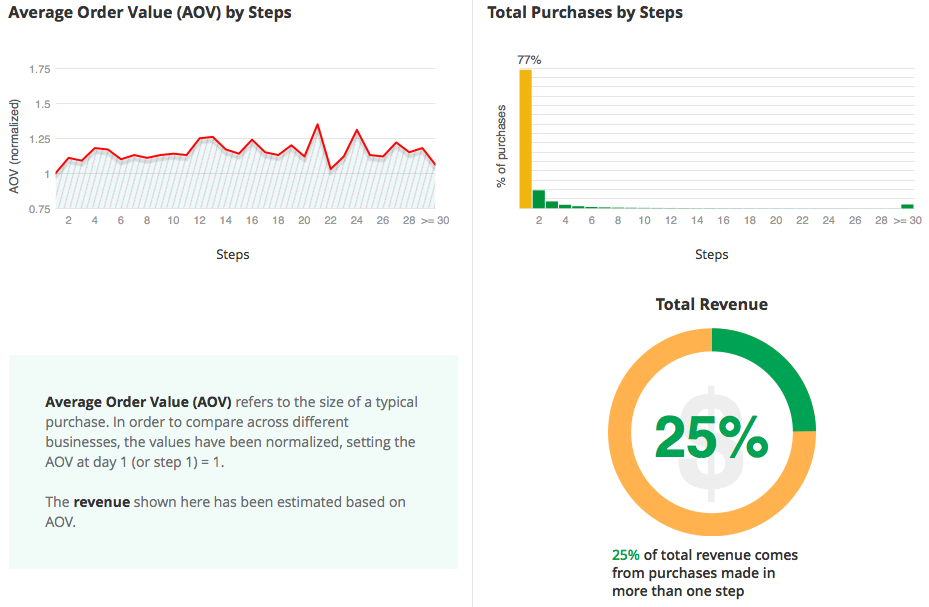
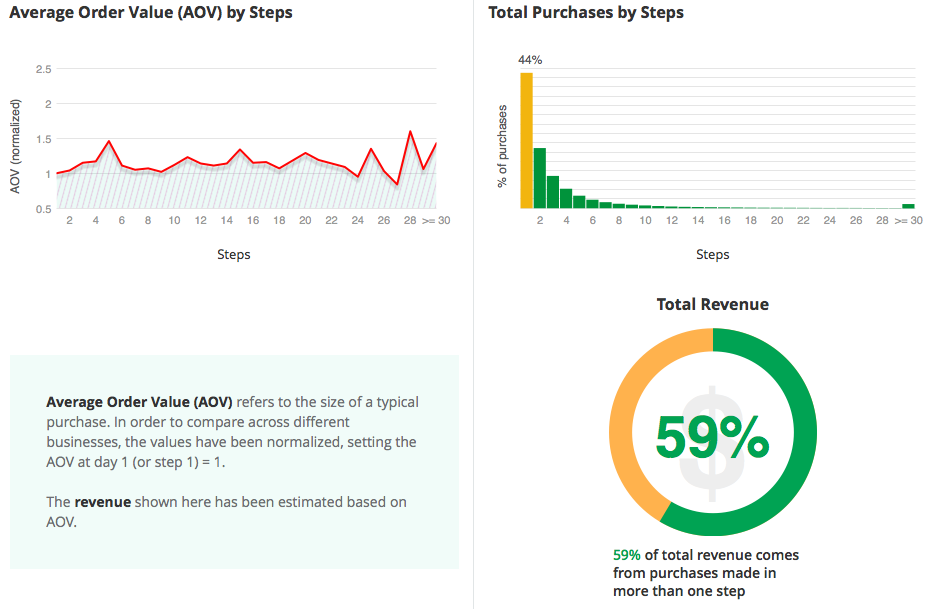
As can be seen above, there is a stark difference between how American and Canadian travelers purchase online. Canadians, it seems, tend to break down their purchases in various steps, with close to 60% of total revenues coming from purchases made in more than one step.
Compare this with their U.S. counterparts, who tend to prefer one-stop shopping, with 77% of purchases taking place in one step only, leaving only 25% of total revenues coming from purchases made in more than one step. Conclusion? Further analysis would be required in order to draw some clear conclusions from these results, but they do tend to show a preference for U.S. travelers to opt for one-stop shopping, through online travel agencies such as Expedia, Booking.com, Travelocity or meta-search sites such as Kayak.
ACTIONABLE INSIGHTS
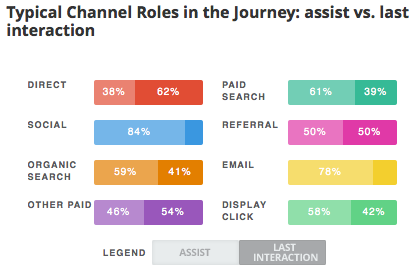
This Google report widget has great value in comparing with other industries, or even within the travel vertical comparing with different countries. Yet there is one report I find to be most insightful: looking at typical channel roles in the customer decision journey, in particular at the assist vs. last interaction stages.
Since social media and other e-marketing tactics often tend to be put into the same basket – they either “sell” or not – it’s refreshing to have this visual tool comparing channel impacts.
Whether you are a hotel, a transportation company, a destination or an attraction, you may find these results to fit or not with your past experience. The most interesting point here is that you now have a way to measure up against industry standards, not only for your country but also horizontally comparing with other industries.
Do some of these findings surprise you? I would love to hear back from you and have your feedback regarding this topic.


